Traceroute Command: How to Use and Interpret It
As there are numerous possible causes of a network issue, having the knowledge and tools to troubleshoot it will help save time.
One of the most common and beginner-friendly tools used for this purpose is the traceroute command. However, the report produced from a traceroute process can be confusing to interpret.
With this in mind, we’ll take a closer look at how the tracert or traceroute command works, when to use it, and how to decode its result.

What Is Traceroute Command and When to Use It?
Traceroute or tracert is a command that runs network diagnostic functionality on computer operating systems.
In general, both commands work the same. The difference lies in the operating system – while Linux and macOS use the traceroute command, Windows utilizes tracert.
The traceroute command sends three probe packets through the network and monitors how they reach the destination.
A probe packet will then go through multiple devices such as routers and switches to reach the target IP address in a process called a hop. The traceroute command maps each hop within the route along with its round-trip-time (RTT).
The log may also include other details such as each hop’s device name and IP address.
The traceroute command has similar functionality to the ping command. However, unlike the ping command, traceroute enables easier troubleshooting in a large network with more devices like intermediate routers and bridges.
It uses the Internet Control Message Protocol (ICMP) to detect problems during a network connection and report the exact location of packet loss.
For example, if the longest delay occurs at your local router, it means you should start troubleshooting the issue there.
How to Run Traceroute (Tracert) Command
Users can mainly initiate the traceroute or tracert command through the built-in command-line application. However, the exact method to run it differs depending on the computer’s operating system.
Let’s take a look at how to run the traceroute or tracert command on Linux, macOS, and Microsoft Windows.
Running Traceroute Command on macOS
macOS users can run the traceroute command via the terminal application.

The traceroute command in macOS works similarly to the one on Linux. The basic command is traceroute followed by the destination hostname or IP address. Most of the advanced options for macOS’s tracert are similar to the Linux version with only minor differences.
Running Traceroute Command on Linux
Linux users can run the traceroute command on the terminal. To do so, type this command line with the following format:
traceroute [options] <hostname or IP> [packet length]
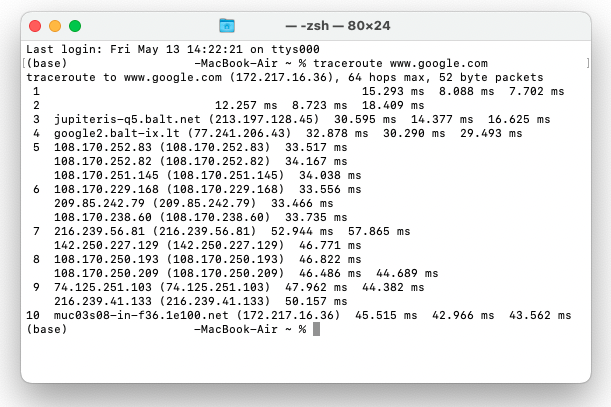
The most common use of traceroute is by typing the command followed by the address of your traceroute destination. This can be an IP address or a domain name, like in this example:
traceroute www.google.com
With this command line, you can trace the route that connects your computer to Google’s website and the details of each hop along the way. The results will look similar to the example below.
[root@server ~]# traceroute www.google.com
traceroute to www.google.com (216.58.212.132), 30 hops max, 60 byte packets
 1  46.17.174.43 (46.17.174.43)  0.036 ms  0.016 ms  0.016 ms
 2  te0-2-1-6.rcr21.vno01.atlas.cogentco.com (149.14.10.41)  0.614 ms  0.643 ms ip-217-117-27-137.bnk.lt (217.117.27.137)  2.055 ms
 3  jupiteris-Q5.balt.net (213.197.128.45)  9.590 ms  9.595 ms be2842.ccr22.sto03.atlas.cogentco.com (130.117.51.162)  12.229 ms
It is also possible to add advanced options to the traceroute command to make your results more specific. Here are some advanced traceroute options for Linux:
| Command | Description |
-I | Linux’s traceroute command sends UDP probe packets by default. You can use this option to change them into ICMP packets. |
-n | Exclude device names from traceroute results. |
-q number of packets | By default, traceroute sends three packets. You can change this number by using this option, followed by the number of packets. |
-d | Enable socket-level debugging. |
-m max_ttl | Specify the maximum number of hops for the tracing process. The default max_ttl value is 30. |
-w wait_time | Define the maximum waiting time for each reply. |
-r | Bypass the normal routing tables and send the IP packets straight to the host on a directly attached network. |
-p | Set the destination port for the query. The default port is 33434. |
-g gateway_addr | Direct the outgoing packets to a specified gateway using the IP source routing option. |
You can also use these advanced options individually or combine them into a single traceroute configuration. For example:
traceroute -Inq 2 www.google.com
Use the man traceroute command to look at other information about the traceroute command, including other available options and how to use them.
Running Tracert on Microsoft Windows
Windows users can initiate the tracert command using the Command Prompt console. Press the Windows + R key combination to open the Run dialog box and type cmd in the search bar.
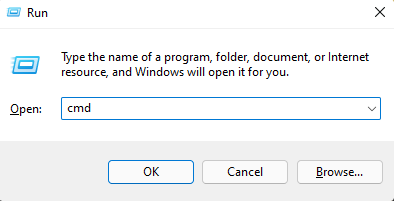
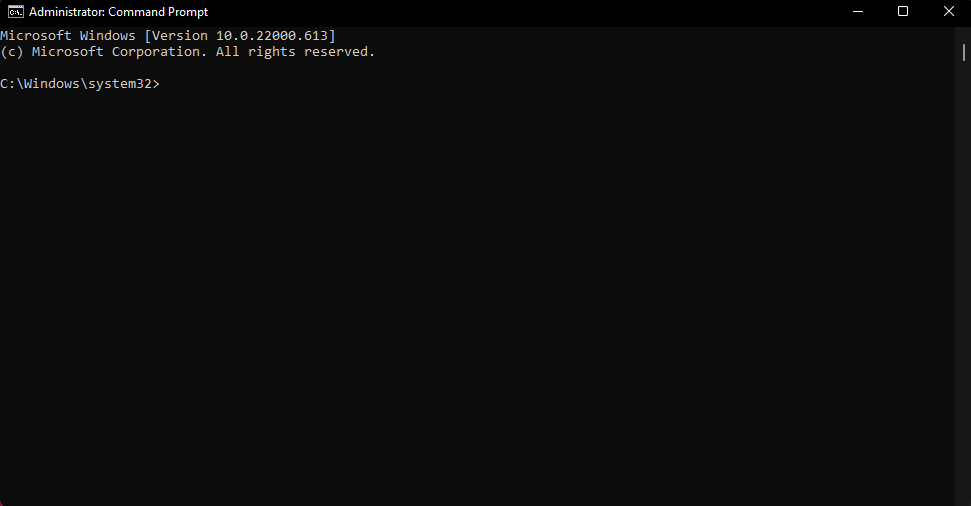
This will open a new console window where you can input various commands, including tracert.
After you type tracert and press Enter, the console will show you how to use this command properly. The most basic way to do this is to type tracert and include either the target domain name or IP address.
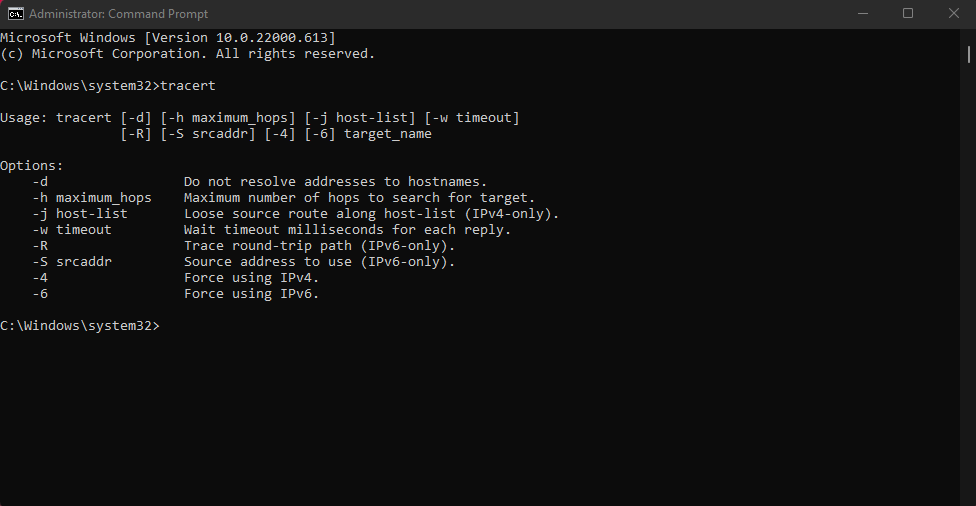
To make the trace result more specific, use the following several options.
| Command | Description |
-d | Prevent tracert from resolving IP addresses to their respective hostnames for each hop. This typically allows the system to show trace results faster. |
-h maximum_hops | Specify the maximum number of hops included in the tracert process. If you don’t change the maximum_hops value, it will follow the default maximum of 30 hops. |
-w timeout | Specify how long the maximum reply time for each hop is before it is considered a timeout. This option is measured in milliseconds. |
-n | Configure tracert to not resolve IP addresses to their domain names. |
-4 | Force the tracert command to use IPv4. |
-6 | Force the tracert command to use IPv6. |
Some options like -j host-list and -S only work on a specific IP version. Make sure to type the option between the tracert command and before the target name.
The console will then run the function and show you results like in the picture below.
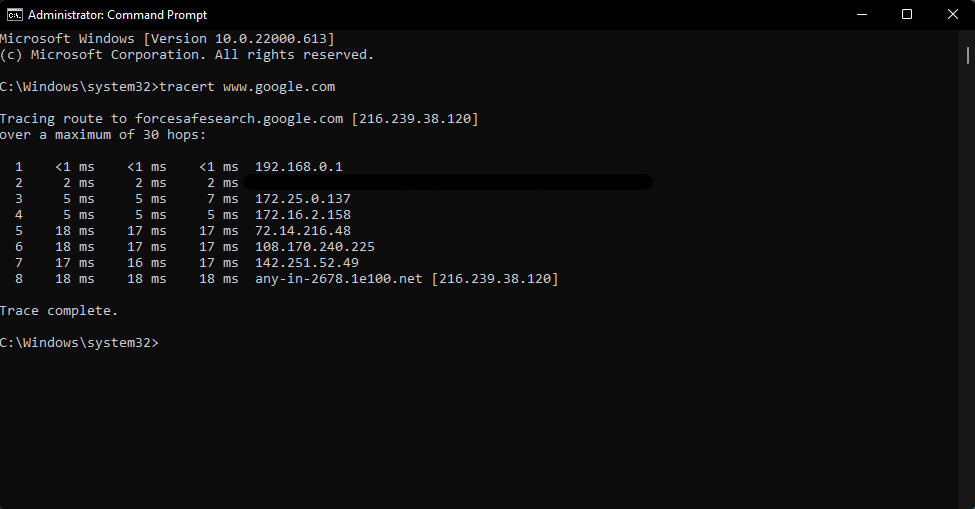
Reading Traceroute Results
After running the tracert or traceroute command, the system will present the results in rows. The report may look slightly different depending on your operating system, but they generally show the same information.
A typical tracert or traceroute report includes several rows representing each hop a packet takes to reach the destination host. Each row is divided into columns with different information. Let’s examine each column and its details.
| Hop number | RTT 1 | RTT 2 | RTT 3 | IP address/hostname |
12 | 18 ms | 17 ms | 17 ms | 10.246.173.157 |
- Hop number – the first column represents the number of hops for the particular row.
- RTT – round-trip time or RTT represents how long each packet takes to reach a particular IP address and return to your computer. There are three different RTT columns since the traceroute sends three UDP packets by default.
- IP address or hostname – this column represents the IP address or hostname of the device on that particular hop.
If there is an issue during a hop, the traceroute report will show an error message based on the problem’s type. There are three types of common error messages in traceroute:
- Request timed out – typically represents a network issue. It might happen due to problems on the return path or the destination’s security device blocking your request.
- Asterisk symbols under RTT columns – this means that the device has failed to respond to your request before the specified time is exceeded.
- Destination net unreachable – informs you that the IP packets have failed to find a route to the destination address and stopped traveling within the network. The most common causes of this problem are an issue with the router or a nonexistent destination IP address.
Traceroute may also show some annotations after each hop which indicate errors during the process:
| Annotation | Description |
!H | Destination host unreachable |
!N | Network unreachable |
!P | Protocol unreachable |
!S | Source route failed |
!F | Fragmentation needed |
The main element you should focus on when interpreting a traceroute result is the hop time listed under the RTT columns. During the traceroute, a healthy and regular network connection typically reports consistent times – also known as latency.
However, the increased latency doesn’t always mean an issue within the network.
The best way to read a traceroute report is to look at the pattern over the whole report instead of focusing on individual hops.
Let’s take a look at four common patterns of traceroute results and how they correlate to your network condition.
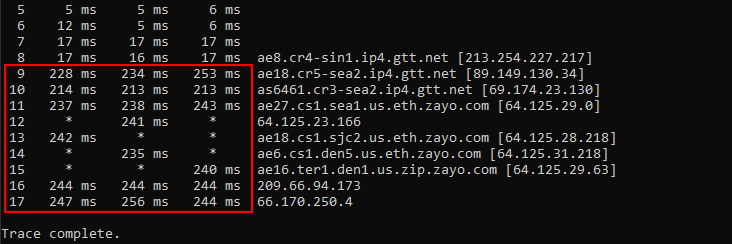
Increasing Latency Towards the Destination
You may see a sudden high latency in a hop where it keeps increasing towards the destination host. In some cases, you may also see asterisks that indicate packet loss. This pattern indicates that the issue comes from the hop where the latency started to increase.
High Latency in Beginning Hops
If you see high numbers at the beginning of the traceroute report, there may be an issue within your local network. To solve this, focus your troubleshooting efforts on local network devices like routers, switches, and cables.
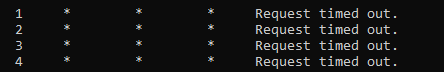
Timeouts at Beginning Hops
The traceroute result may show request timed out messages within the first one or two hops but show regular times for the rest of the hop. This is a normal occurrence and doesn’t indicate any issue since some routers are not configured to respond to a traceroute request.
Timeouts at the End of the Report
There are several causes of timeouts at the end of the traceroute, including:
- The target’s firewall or security devices blocking the traceroute request.
- An issue with the return path from the destination computer.
- A possible connection issue at the target address.
The first two scenarios won’t affect your connection to the destination network, but the third one may result in a failed connection.
These patterns can help you identify the source of a connection problem and the action you may need to take. There are different parties to contact depending on where timeouts and high latency occur in case you cannot solve the issue yourself.
Issues within the first hops mean you might have to contact your network administrator. The next hops represent your internet service provider (ISP), encouraging you to reach out to their customer support.
The last hops are within the destination network area, and there are two possibilities for this pattern. If you are the user of the website or web application, you can contact their administrator or wait for the issue to be resolved.
On the other hand, the website owner can contact their hosting provider and ask for technical support to help solve the issue.

Conclusion
The traceroute command is a useful and easy-to-run network diagnostic tool. Typically, it is the first way to troubleshoot a connection issue.
The command might differ depending on your operating system – Linux and macOS use traceroute, while Windows utilizes tracert. Each operating system also has a slightly different way to run the command, either using the command prompt or terminal.
However, the general function and information presented in the report are similar. A traceroute or tracert report typically contains rows of hops with RTT and IP addresses or hostnames of the particular hop.
The key to interpreting a traceroute report is to look at the pattern and spot the inconsistencies. Understanding these patterns can help you narrow down the source of the issue and determine the next possible action.
Hopefully, this article has helped you to use and read the traceroute function properly. If you have any questions or additional tips regarding this topic, let us know in the comment section below.

Pras has a background in IT education and experience as a website administrator, he hopes to share his knowledge with other tech enthusiasts. In his free time, Pras likes to play video games.